Type of indicator
Sectoral
Indicator C27
Total factor productivity in agriculture
Definition
Total factor productivity (TFP) compares total outputs relative to the total inputs used in production of the output. As both output and inputs are expressed in term of volume indices, the indicator measures TFP growth. The change in production and input volumes is measured over a defined period (2010=100). To aggregate the different output (and input) volume indices, the production (and input) values are used as weights. This allows capturing the relative importance between outputs, or inputs.
TFP reflects output per unit of some combined set of inputs: an increase in TFP reflects a gain in output quantity which is not originating in from an increase of input use.
As a result, TFP reveals the joint effects of many factors including new technologies, efficiency gains, economies of scale, managerial skill, and changes in the organization of production.
TFP index is defined as the ratio between an Output Index (i.e. the change in production volumes over a considered period) and an Input Index (the corresponding change in inputs/factors used to produce them).
Output and input indices are calculated as weighted averages of changes in produced quantities and in input quantities respectively, where the weights are represented by the production value of the various products and the expenditure for each of the four considered production factors (intermediate inputs, land, labour, capital).
Depending on the type of average applied and the chosen reference period for the weights, the TFP indicator assumes different analytical forms. Laspeyres indices are defined as arithmetic means with weighting factors referring to the time 0 (base year), while Paasche indices are harmonic means with weighting factors referring to the time t (current year).
In formula, the TFP Laspeyres index is given by: ,
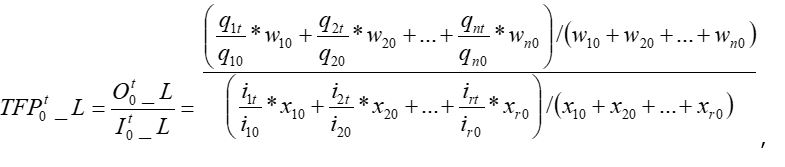
while TFP Paasche index is defined as:
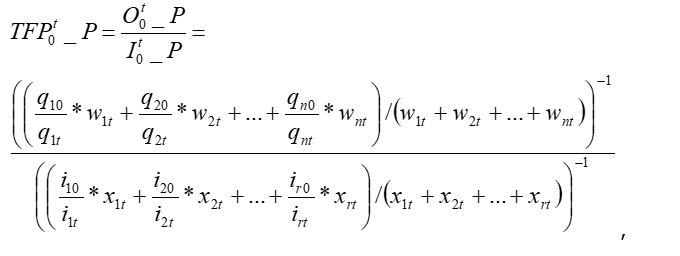
where q jt and i ktare respectively the quantity of product j and factor k at time t, while w jt and X ktare the weights of product j and factor k within the agricultural sector.
Finally, the geometrical average of the Laspeyres and the Paasche index gives the Fischer index, which benefits from the most suitable statistical properties. In formula, the TFP Fisher index is computed as follows:
TFP_F = √ TFP_L * TFP_PUnit of measurement
Index (3-year moving average)
Data source
The Economic Accounts for Agriculture (EAA) from Eurostat.
The volume indices calculated by Eurostat are Laspeyres indices and changes in volume are measured using the weightings for the preceding year to guarantee the weightings are relatively up-to-date (see Reg. N° 138/2004). They correspond to the term qlt/ql0 of the equations displayed above.
Precise indicators chosen in the EAA:
- Change in output volume (qlt/ql0): Volume Indices, n-1 = 100, Production value at basic price (aact_eaa05)
- Output weights: Real price in Euro, 2010 = 100, Production value at basic price (aact_eaa04)
- Change in input volume (ilt/il0) for every input except land and labour cost: Volume Indices, n-1 = 100, Production value at basic price (aact_eaa05)
- Input weights: Real price in Euro, 2010 = 100, Production value at basic price (aact_eaa04)
- Volume index for labour costs: Change in Total labour input measured in 1000 AWU (aact_ali01)
- Correction of the weight for labour costs to cover the family labour costs: the compensation of employees is divided by the share of paid labour also directly available from the EAA (aact_ali01)
- Volume index of the UAA: Change in Total UAA available in the EAA (apro_cpsh1).
Complementary data is required from:
- the Farm Structure Survey (FSS - Eurostat) to assess the share of rented land (in order to correct the weight of land by including the own land)(ef_mptenure).
- the Agricultural Production Data – Crop Products (Eurostat) for the volume index of the UAA (apro_cpsh1).
- the Farm Accountancy Data Network to estimate the national average depreciation rate.
References/location of the data
Eurostat: EAA, APRO, ALI, FSS; FADN
Data collection level
National (NUTS 0)
Frequency
Annual
Delay
Year N-2
Comments/caveats
The climatic conditions affecting crop yields have strong impact on the crop output and as a consequence on the indicator. Therefore, a moving average over 3 years is to be calculated to smooth the weather effect.
The level of detailed information required to compile the indices (especially for the Paasche Index) does not allow for calculating long time series and complicates the calculation for the EU aggregates.
The length of the time series varies according to MS.
There are breaks in time series and data is missing for some years, especially in the Agricultural Production Data. The methodology to value the fixed capital consumption seems to vary over time. Concerning the labour input any change in accounting rules has been normally smoothed. Nevertheless this volume index is to be checked very carefully because the TFP indicator is very sensitive to any variation in labour input.
The calculation of regional values is not possible due to the lack of data at such detailed geographical level.