Type of indicator
Environment
Indicator C33
Farming intensity
Definition
This indicator consists of 2 sub-indicators:
1. Farm input intensity
2. Areas of extensive grazing
1. Farm input intensity is expressed as the utilised agricultural area (UAA) managed by farms with low, medium and high input intensity, as percentage of total UAA.
The input intensity of a farm can be defined as the level of inputs used by the farm per unit of production factor (in general land). Intensification is defined as the increase in farm intensity, while extensification describes the opposite trend.
Farms are classified into intensity categories according to an estimate of input volume per hectare of UAA. The inputs considered are fertilizers, pesticides, other crop protection products and purchased feed. This approach allows covering both crop and livestock productions.
The volume of inputs used (per hectare) is estimated by dividing input expenditures (per hectare) by the input price index for the year and country in question. This results in input expenditures per hectare in constant national input prices. Fertiliser expenditure (purchased fertilisers and soil improvers) is divided by the fertiliser price index in the country of the same year in order to estimate the volume used. Similarly, crop protection expenditure (plant protection products, traps and baits, bird scares, anti-hail shells, frost protection) is divided by the pesticide price index in the country of the same year. Purchased feed cost is also divided by the feed price index in the country of the same year. The result is thus expressed in constant inputs prices (Euro per ha). The method allows not only to deduct inflation, but also the fluctuation of input prices. Thus it estimates the trend in the volume of inputs used per hectare. However, it does not capture differences in input prices between countries and the differences in prices within each category of inputs (for example between a pesticide A and a pesticide B). Therefore it does not give the exact volume of inputs used for a specific country and year.
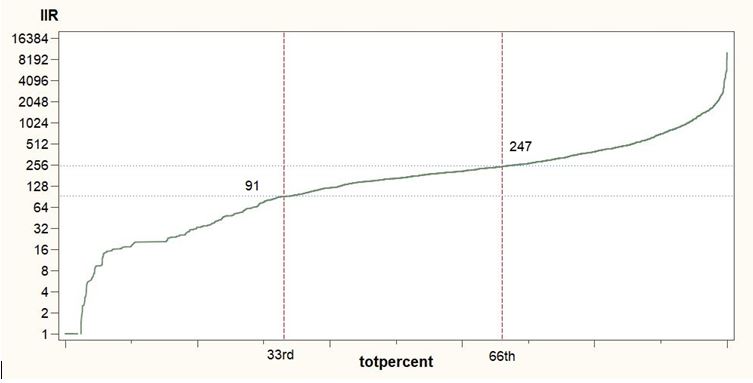
In a second step, the distribution of the UAA is considered by the ranked input intensity (bivariate approach) in each geographical level (EU, MS, NUTS) for the specific year of reference (2010 for all MSs, 2013 for HR). Three classes of intensity (low, medium, high) are then defined, by deriving the associated level of input corresponding to the 33rd (q33) and the 66th (q66) UAA quantiles.
A farm is classified under the class “low intensity” if its input level is below or equal to the intensity value associated to the Q33 of UAA (see, as an example, the graph below: 91 euros/ ha for AT - 2010).
A farm is classified under the class “high intensity” if its input level is greater than the intensity value associated to the Q66 of UAA (in the graph below: 247 euros/ ha for AT 2010).
A farm is classified under the class “medium intensity” if its input level is greater than the intensity value associated to the Q33 of UAA and it is below the intensity value associated to the Q66 of UAA.
For EU28, as well as for EU27_2020, those thresholds are represented by 88 euros/ha for low intensity farms, by 560 euros/ha for high intensity farms, and by between 88 and 560 euros/ha for medium intensity farms.
These levels should not be considered as strict cut-off values, but rather as reference in time in order to be able to study the evolution of farm intensification through the years.
Once the farms are classified in one of the three intensity classes (low, med, high), a global ratio indicator is computed as the weighted sum of input over the weighted sum of UAA for each intensity class.
Intensification in a country with very low intensity does not mean the same for the environment than intensification in a country with high intensity. That is the purpose of the variable, "average input expenditures per hectare in constant input prices". It is not the ideal measurement of intensity; however, it is the best estimate that we can obtain until now from the available data.
The methodology for the calculation of this indicator is applied as well to the agri-environmental indicator 12 "intensification/extensification":
http://ec.europa.eu/eurostat/statistics-explained/index.php/Agri-environmental_indicators
2. Areas of extensive grazing measures the area under grazing livestock production (cattle, sheep and goats), where the stocking density does not exceed 1 livestock unit per ha of forage area (forage crops, permanent pastures and meadows), as share of the total UAA.
For each region (NUTS 2), the livestock density per ha of forage UAA (fodder crops + permanent grassland) is calculated. If the livestock density is less than 1 LU/ha the regions is classified as extensive; if it is more than 1 LU/ha, the regions is classified as intensive. Then the share of forage UAA in total UAA for each "extensive" NUTS 2 is calculated.
In each region the following information is needed:
- total UAA, UAA used for fodder crops and UAA for permanent grassland;
- numbers of grazing livestock (bovine by sex and age, sheep, goats) in LU;
Since the evaluation of the extensive character of agriculture should be made at the most detailed geographical level possible, the extensive character of agriculture at Member State level is determined by aggregating values at NUTS 2 level.
Unit of measurement
1. % of total UAA. (The variable "average level of intensity" per country or region is expressed in "Euro per ha in constant input prices").
2. ha and % of total UAA
Data source
1. Farming intensity
- DG AGRI - Farm Accountancy Data Network (FADN)
- Eurostat - Price indices of the means of agricultural production, input.
2. Eurostat - Farm structure survey (FSS).
References/location of the data
1. Farming intensity
- DG AGRI - Farm Accountancy Data Network (FADN). Name of current variables defined in the FADN: SE295 Fertilizers; SE300 Crop protection; F64 to F67 Purchased feedstuffings, SE025 Utilised Agricultural Area:
http://ec.europa.eu/agriculture/rica/;
https://circabc.europa.eu/faces/jsp/extension/wai/navigation/container.jsp
- Eurostat - Price indices of the means of agricultural production, input (2010 = 100) - annual data (apri_pi10_ina).
Products: 203000 - FERTILISERS AND SOIL IMPROVERS, 204000 - PLANT PROTECTION PRODUCTS AND PESTICIDES, 206000 - ANIMAL FEEDINGSTUFFS.
2. Areas of extensive grazing
- Eurostat - Farm structure survey (FSS), Tables: Crops by classes of utilised agricultural area in number of farms and hectare by NUTS 2 regions [ef_lus_allcrops]; Bovine animals by NUTS 2 regions [ef_lsk_bovine], Sheep by NUTS 2 regions [ef_lsk_sheep], Main livestock indicators by NUTS 2 regions, live goats [ef_lsk_main].
Data collection level
1. National (NUTS 0), regional (NUTS 2); primary data refer to FADN regions.
2. National (NUTS 0), regional (NUTS 2)
Frequency
1. Annual
2. FSS: full census every 10 years, intermediate survey 2-3 times in-between.
Delay
1. 2 years
2. 3 years
Comments/caveats
2. Areas of extensive grazing:
For DE, CY data at NUTS2 level are not available at the date of this update, therefore, according to the methodology, it is not possible to derive the information on the extensive area.