Adding Value - Infopage
Focus on the value added in agriculture including EU quality schemes and producer organisations.
Background information

This dashboard aggregates data on the distribution of gross value added along the food chain and focuses on means to add value to agricultural products: EU quality schemes and producer organisations. The EU agricultural product quality policy and the governance of agri-food markets through the Common Market Organisation Regulation (CMO), especially on the side of producer organisations, are the main instruments available in the CAP to add value to agricultural products.
The EU quality policy aims at protecting the names of specific products to promote their unique characteristics, linked to their geographical origin as well as traditional know-how. Product names can be granted with a 'geographical indication' (GI) if they have a specific link to the place where they are made. The GI recognition enables consumers to trust and distinguish quality products while also helping producers to market their products better. Key information on the EU quality schemes (Protected Designation of Origin (PDO), Protected Geographical Indication (PGI), Geographical Indication (GI) and Traditional Speciality Guaranteed (TSG)) are displayed. To know more about the EU quality policy, click here.
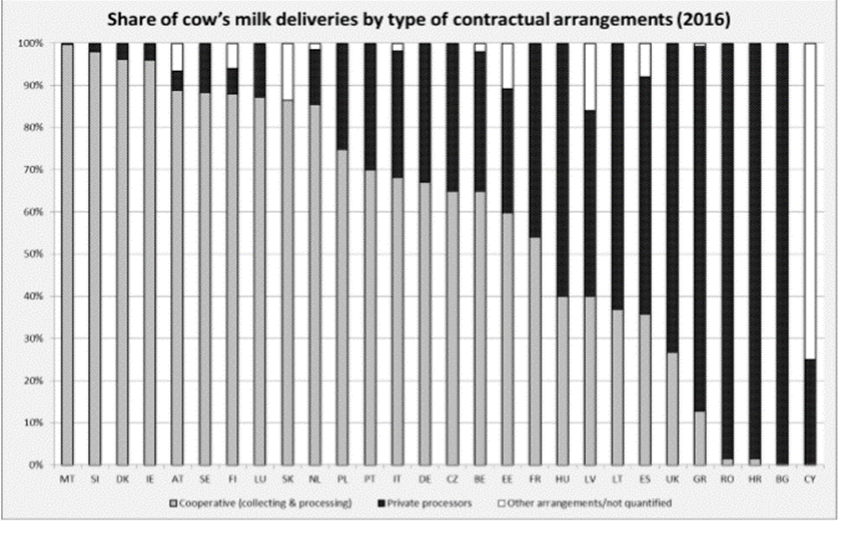
Encouraging the setting-up of Producer organisations (POs) and Associations of Producer Organisations (APOs) is one way to contribute to the improvement of farmers' position in the agricultural and food supply chain. Operators can use Rural Development funds to set-up POs. The EU fruit and vegetables regime supports POs for implementing operational programmes with funding contributions. The "Milk Package" introduced in 2012 a series of instruments to improve the supply chain in the dairy sector and to increase its resilience following the end of the quota system in 2015. It promoted collective negotiation through POs: farmers can join together in PO that can negotiate contracts terms collectively (within certain quantitative limits so as not to distort competition), including the price of raw milk.
In case data are missing for some Member States, EU totals are calculated with the available information.
Figure: Products under EU quality schemes
Indicator(s) used in the graph:
Notes:
- eAmbrosia is the EU geographical indications register.
- Mapping : See table "PGI/PDO/GI/TSG" at the end of this info sheet (sum of data's cumulated over year).
Figure: Number of recognised Producer Organisations
Indicator(s) used in the graph:
Notes:
- ISAMM is one of the data systems used by Member States to send their notifications to the European Commission, notably for producer organisations.
- The data is cumulated over time and includes both Producer organisations (POs) and Associations of Producer Organisations (APOs). Member States notify new and withdrawn POs every year. The notification of recognised POs was implemented before in certain sectors such as fruit and vegetables and the dairy sectors. To get the full picture in all sectors, the data is based in part on notifications and in part on a study for the past (up to 2016).
Graph: Products under EU quality schemes
Indicator(s) used in the graph:
Notes:
- eAmbrosia is the EU geographical indications register.
- Mapping : See table "PGI/PDO/GI/TSG" at the end of this info sheet (sum of data's cumulated over year).
Graph: Distribution of EU quality schemes
Indicator(s) used in the graph:
Notes:
- eAmbrosia is the EU geographical indications register.
- Mapping : See table "PGI/PDO/GI/TSG" at the end of this info sheet (sum of data's cumulated over year).
Graph: Share of F&V production marketed by Producer Organisations
Indicator(s) used in the graph:
Notes:
- ISAMM is one of the data systems used by Member States to send their notifications to the European Commission, notably for producer organisations.
- The graph includes data from both PO's (Producer Organisations) and APO's (Association of Producer Organisations) in the Fruit and vegetables (F&V) sector.
Graph: Share of raw milk delivered by recognised Producer Organisations
Indicator(s) used in the graph (unit %):
Mapping with legend(s) in the graph:
Notes:
- Member States notify annually via ISAMM the number of Producer Organisations (and their Associations) in the milk sector and the volumes of milk collectively negotiated by them. The graph includes data from both PO's (Producer Organisations) and APO's (Association of Producer Organisations). Provisions on Producer Organisations are not particularly relevant in Member States with a strong presence of cooperatives (about two third of the milk delivered in the EU is marketed by cooperatives). This is the main reason why there are no PO's recognised in several Member States. More information available here.
Graph: Distribution of Gross Value Added along the food chain (million EUR)
Indicator(s) used in the graph:
Mapping with legend(s) in the graph:
Notes:
- The indicator looks at the structure of the food chain and calculates the share of the primary production (agriculture) on the total value added generated by different participants of the food chain (primary production, food manufacturing, food distribution and food service activities).
MAP: Share of holdings receiving support for participating in quality schemes
Indicator(s) used in the graph:
Notes:
- The Focus Area 3A of Rural Development Programmes is improving competitiveness of primary producers by better integrating them into the agri-food chain.
- The number of holdings benefitting of support for participating in quality schemes, local markets, short supply circuits and POs are reported by Member States to the Commission in the Annual implementation reports (AIR) of Rural Development programmes.
- The total number of holdings in the EU comes from the Eurostat Farm Structure Survey. As this figure is not available every year, the figure of number of holdings used to calculate the indicator is the one of the year closest to the corresponding AIR (e.g. for AIR 2015 the 2016 Eurostat Farm Survey figure is used).
PGI/PDO/GI/TSG table
- Protected Designation of Origin (PDO)
- Protected Geographical Indication (PGI)
- Traditional Speciality Guaranteed (TSG)
- Geographical Indication (GI)